Category: English
In this post, I will be investigating public transportation network of Istanbul, specifically of buses. I will create networks from the data I acquire from CitySDK and try to find the bottlenecks/major hubs in Istanbul. I will first crawl the CitySDK with Scrapy and then construct a network with R & visualize it.
CitySDK API
CitySDK is an EU-supported project aiming to provide open data on public transportation. This project have been tested on 8 cities and one is Istanbul. Istanbul Municipality provides an API, giving access to public transportation information for free.
You can query bus line list with:
curl http://apicitysdk.ibb.gov.tr/ptlines?per_page=1000&page=1
returning you a list of objects one of which is:
{"cdk_id":"gtfs.line.1.14es-0","name":"1 bus 14ES","node_type":"ptline","layer":"gtfs"}
Here is cdk_id is the unique code for the line. name tells us the type (bus) and the line code (14ES). If we wanted to see details of this line, we can query it via:
curl "http://apicitysdk.ibb.gov.tr/gtfs.line.1.14es-0/select/nodes?per_page=200&geom"
This will result in a list of stops this line passes through:
{"cdk_id":"gtfs.stop.istb.185296","name":"SARIGAZİ GARAJI","node_type":"ptstop","geom":{"type":"Point","coordinates":[29.20184,41.0046]},"layer":"gtfs"},

{"cdk_id":"gtfs.stop.istb.185147","name":"EMEK MAHALLESİ","node_type":"ptstop","geom":{"type":"Point","coordinates":[29.1971,41.00408]},"layer":"gtfs"},

...
where cdk_id is the unique identifier for the stop and coordinates represent the geospatial coordinates of the stop. Two stops in opposite directions but at the same place are represented with different codes and coordinates but with the same name.
Transportation Network
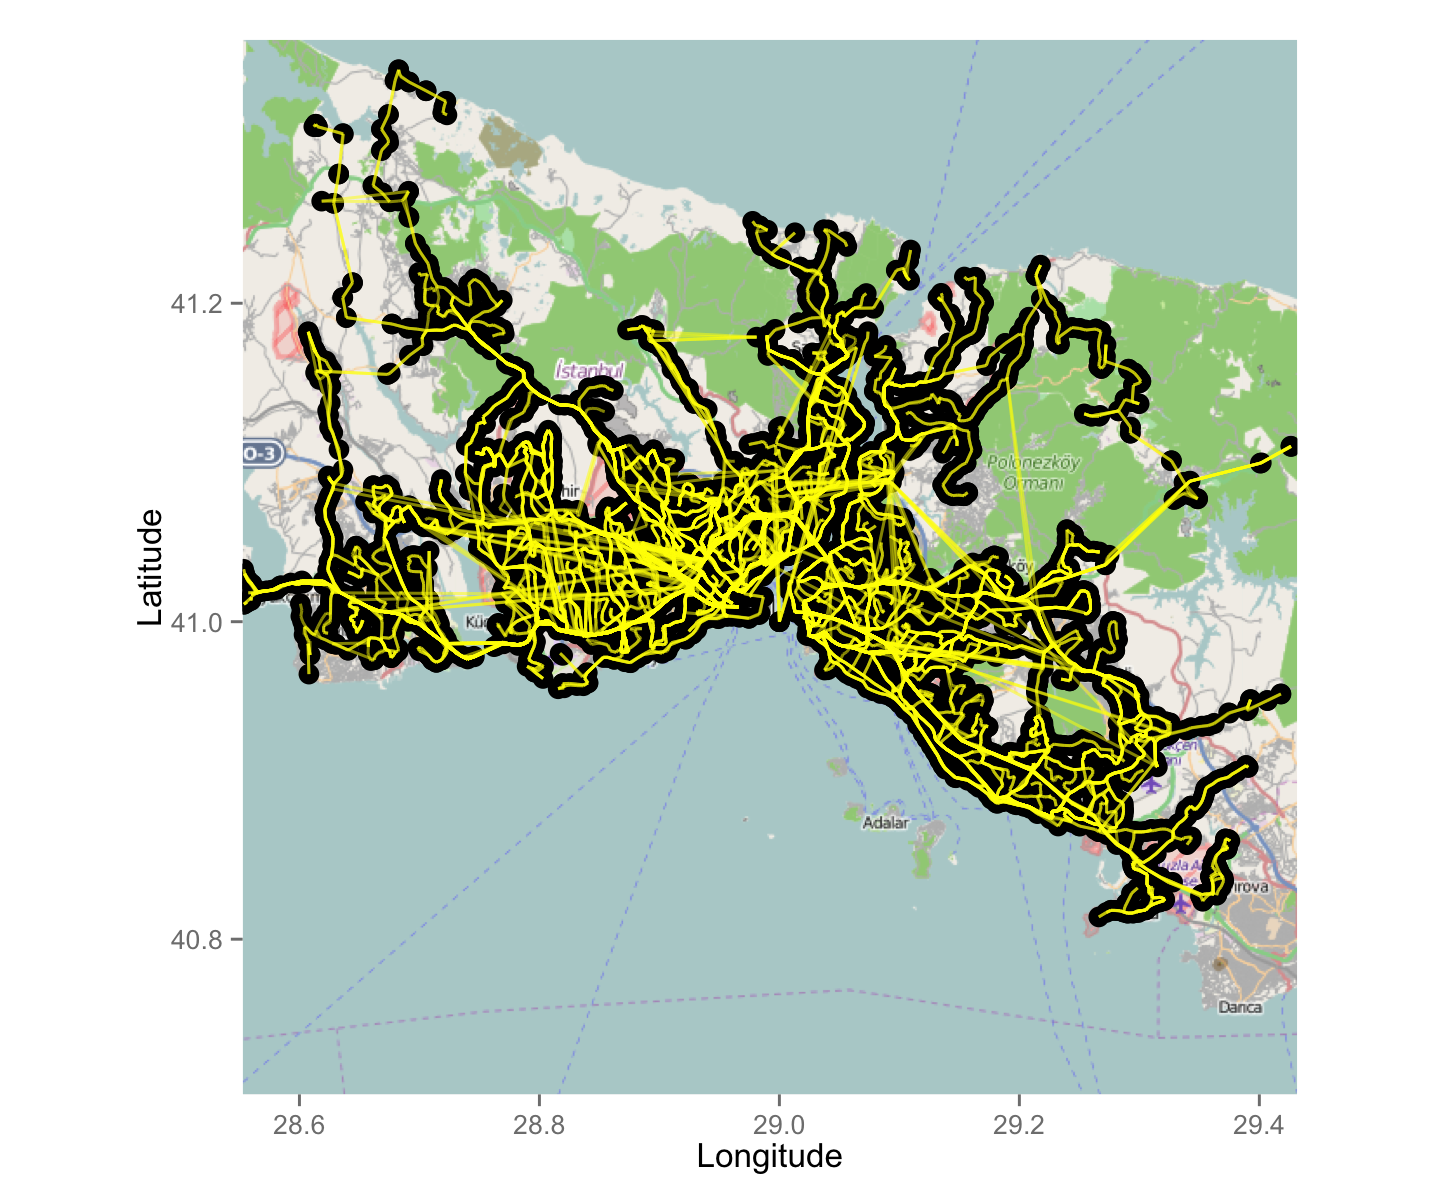
What I wanted to see was the bus network spanning over Istanbul. So I wrote a scrapy crawler that crawls all the 1620 bus lines and their stops with coordinates. Then all I had to do is assuming stops as nodes and creating edges between adjacent stops, resulting in a network. Note that we have to assume there's a straight line between every two nodes. To visualize it, I fixed nodes at spatial stop coordinates and placed them on a Google Map representation. It was a Multigraph with multiple edges (line segments) passing between two stops.
Weighted Transportation Network
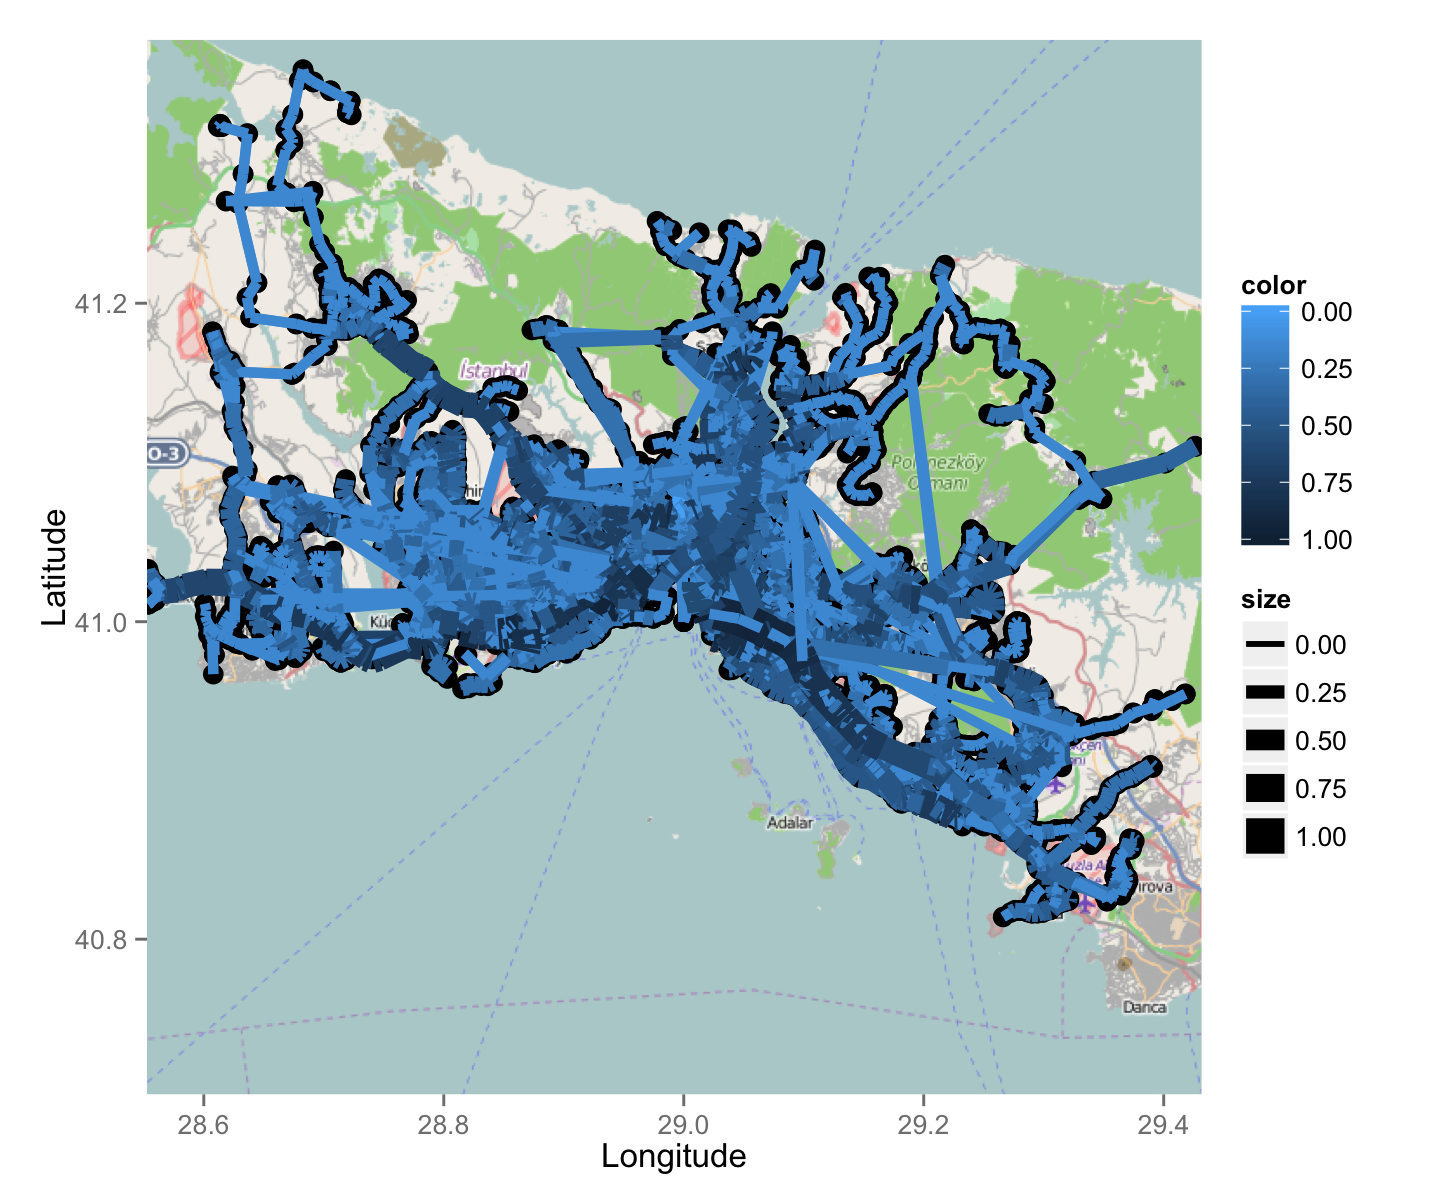
I realized that there were overlapping edges so we were losing a valuable information: edge weights. I decided to take edge weight as the number of lines passing between two stops. This way I could convert Multigraph into Regular graph. I visualized the edge weights with thickness and color where thick/dark edges are the busiest edges:
Edge Betweenness Analysis
Number of lines passing through two stops is a good measure for traffic volume. But what about number of shortest paths passing through an edge? That would be a better one. Let's calculate Edge Betweenness Scores for each edge and visualize it. We have to take logarithm of edge betweenness scores since their values are too divergent. Then we have to remove edges with lower betweenness values for clarity. We should be able to see the busiest road segments of Istanbul.
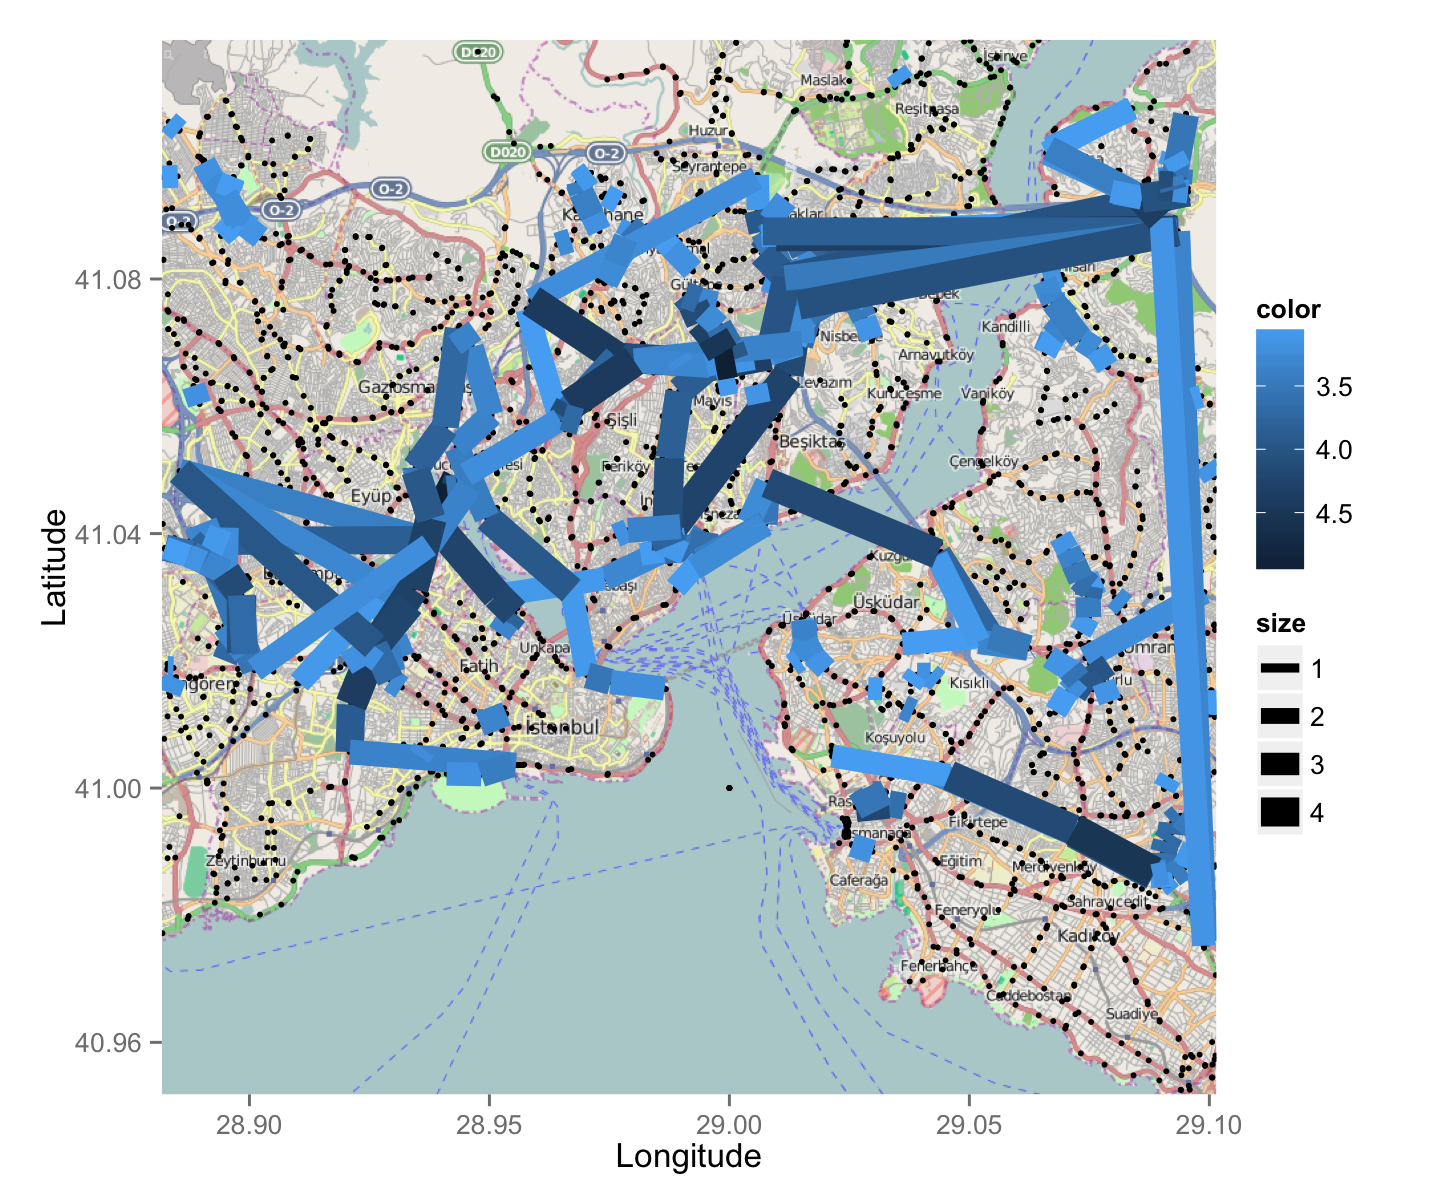
We can see that two bridges of Istanbul have the highest betweenness values. This means that they have very important roles in Istanbul transportation and a failure in the service would cause lots of delays. Next, we can see roads Besiktas-Levent, Sisli-Kagithane, around Sisli, Halic Bridge, Yenisahra E-5. Then we can see the highway (on the rightmost vertical) connecting E-5 to north bridge. These results are complying with my own traffic experience.
Node Betweenness Analysis
If we were to look at stops through which many shortest paths pass through, we get the following list including an airport and lots of shore stops which are in areas where there is only single path to pass through:
- Sabiha Gökçen Airport
- Kavacık Bridge
- Taksim
- Eminönü İskele (Dock)
- Yenikapı Sahil
- Kumkapı
- Sarayburnu
- Dolmabahçe Sarayı
- 4. Levent
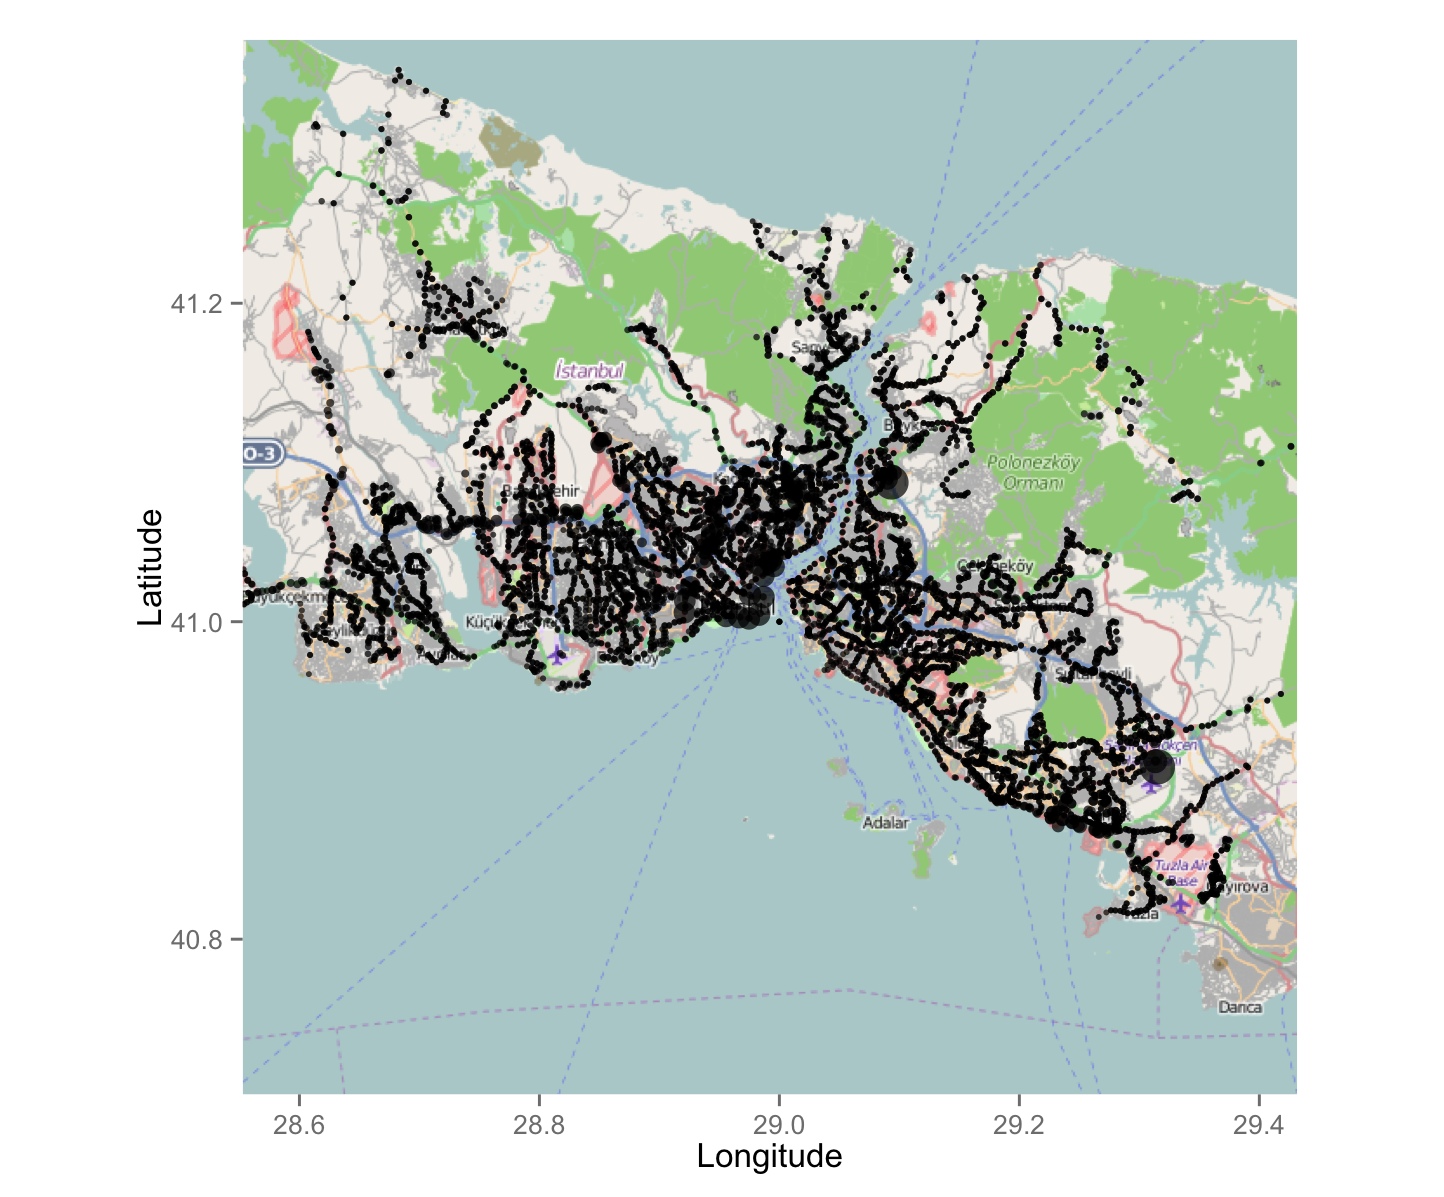
We can visualize this with node size representing node betweenness. We can look an overall look at Istanbul and a more detailed look in central Istanbul.
Overall View:
Detailed View showing only the nodes with the highest betweenness:
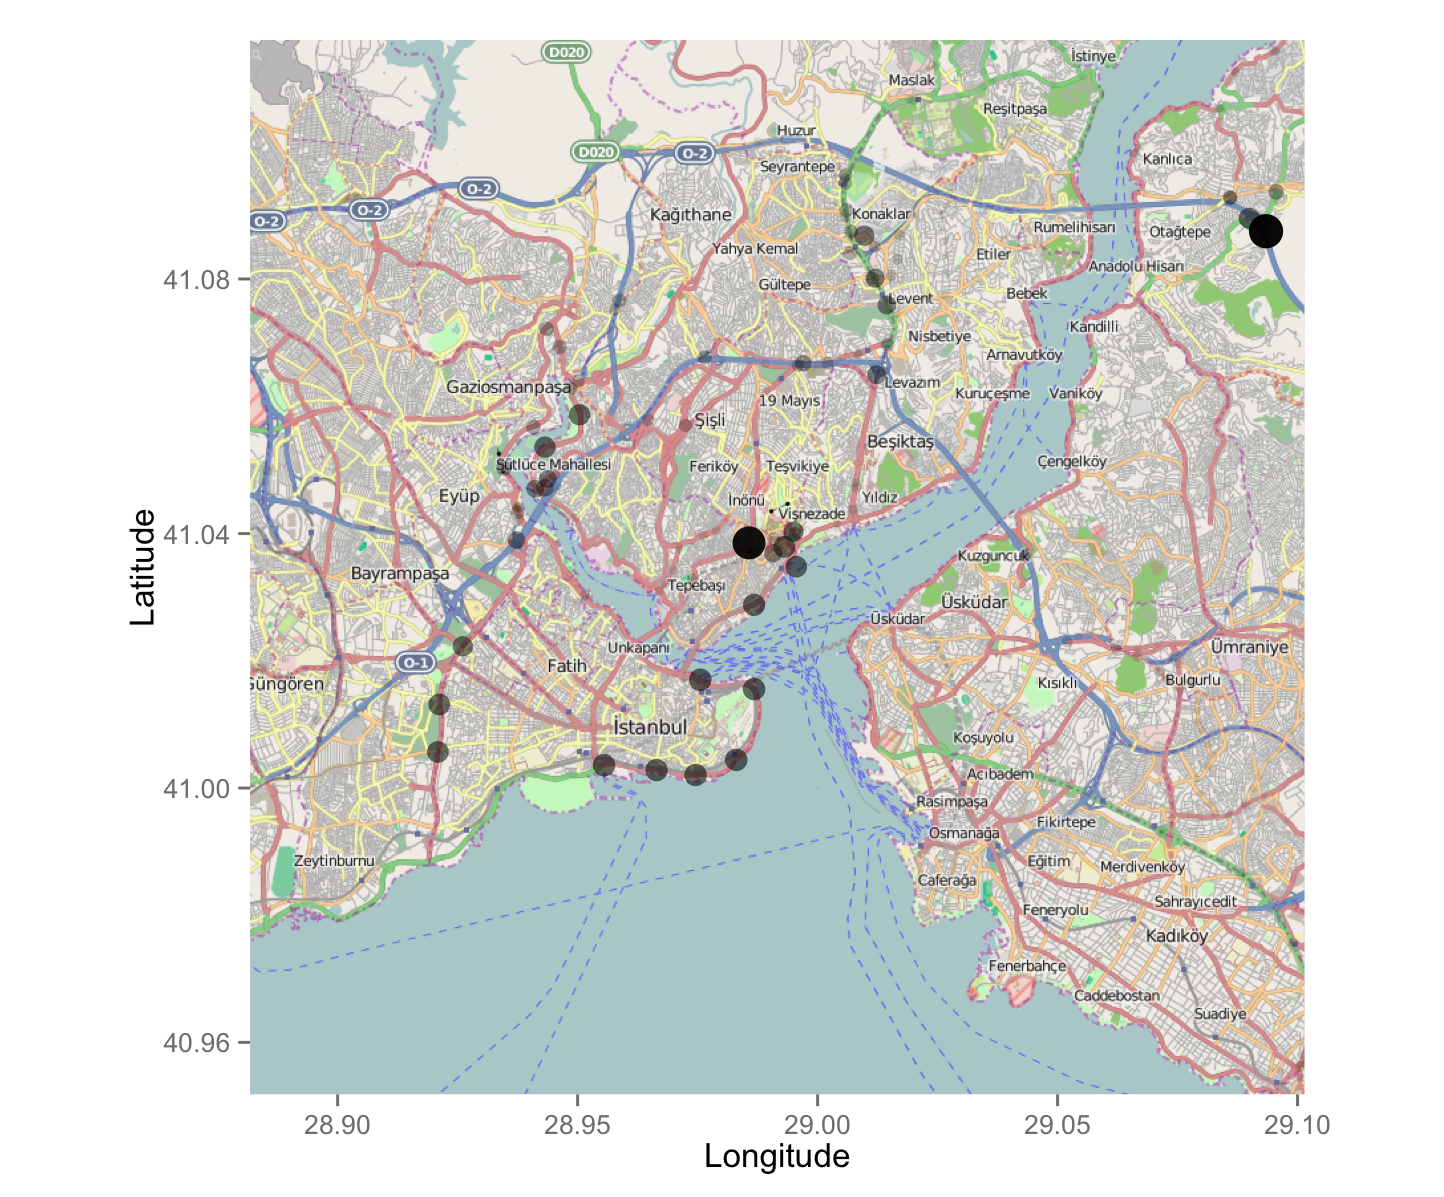
We can see major hubs and de-facto pass-by stops have larger node size.
Conclusion and Source Code
All these results show us that transportation routes give us a nice idea on where the bottlenecks could be and which points are more susceptible to failures (accidents). In other words, we saw the places we would most likely to get stuck in the traffic! More things can be done like merging stops that have the same name and are close to each other (merging the directions).
Source code is avaible here.
Resulting Visuals and RCode is available on RPubs.